Start Here: Establish, Implement & Continuously Monitor a QAPI Program
If your unit has no Quality Assessment and Performance Improvement (QAPI) program yet, or has one that exists only as a binder nobody opens, this is the practical entry point. The three phases below turn the rest of this field manual into a sequence: Establish the scaffold, Implement the first monthly cycle, then Continuously Monitor so the program doesn't decay back into paperwork. Every step links to the section or tool that does the work — you don't need to read the whole manual before you start.
Charter the program
Write a one-page QAPI charter: scope, aim, and owner. Ratify the roles in Section 8 — Medical Director / Dialysis Clinical Head (DCH), Head Nurse, Unit Operations Manager (UOM), infection-control and technical leads, and a quality officer.
Adopt the metric set
Don't invent your own dashboard from scratch — start from the nine-domain Key Performance Indicator (KPI) Dashboard (Section 6) and drop only what genuinely doesn't apply to your modality mix.
Stand up data collection
Deploy the Monthly QAPI Data-Pack Workbook at chair-side so numbers are captured as the month happens, not reconstructed from memory at month-end.
Calendar-block the standing meeting
Schedule the monthly Continuous Quality Improvement (CQI) meeting as a recurring, protected slot — the PSN 2024 HD Guidelines require it monthly, documented (Section 8).
Run your first month's numbers
Type the workbook's totals into the Dialysis Unit QAPI Scorecard for a color-coded read and an auto-drafted improvement charter on every red metric.
Hold the first CQI meeting
Run it with the Monthly CQI Meeting Walkthrough — a guided six-step agenda that ends with filed, printable minutes instead of a free-floating discussion.
Open your first improvement cycle
Take the worst red metric to a Plan-Do-Study-Act (PDSA) cycle; if it traces to an adverse event, run a Root Cause Analysis (RCA); if you're changing a process before it can cause harm, run a Failure Mode & Effects Analysis (FMEA). All three worksheets live in one place: the PDSA, RCA & FMEA Worksheets.
Stand up the remaining printable trackers
Start offering the Patient Experience Survey and logging every complaint on the Grievance / Complaint Log — both feed the experience domain of the dashboard (Section 6.8). File a Vaccination Tracker per patient for the infection-prevention domain (Section 6.5).
Repeat the monthly cycle, indefinitely
Data → Scorecard → meeting → improvement cycle, every month. Plot any metric's month-to-month history on the Run Chart & Statistical Process Control (SPC) Generator to tell signal from noise before reacting. The program is CQI's job once it's running; QAPI is the governance that keeps it running.
Add outcomes-domain rigor
Once you have a full reporting period of deaths and hospitalizations, start tracking your Standardized Mortality Ratio (SMR) with the SMR & Hospitalization Rate Calculator (Section 6.7) — a single period's ratio can mislead, so read it alongside its confidence interval, not alone.
Escalate hard-reds the same day
A hepatitis seroconversion, a water result over limit, or an intradialytic death forces an immediate RCA — don't hold it for the monthly meeting (Section 6 hard-red flags).
Audit the program itself
Quarterly, walk the "QAPI Theater" checklist (Section 12) and ask honestly whether the program is still driving change or has calcified into paperwork updated the week before inspection.
A unit that had "done QAPI" for years — on paper. A new DCH inherits a binder with a QAPI plan dated three years ago and no minutes since. Week 1: charter re-ratified, roles assigned. Week 3: the Data-Pack Workbook is at the nursing station. Month 2: the first Scorecard run flags phosphate-in-range red; the first CQI meeting, run off the Meeting Wizard, opens a PDSA charter the same day. By month 4 the cycle is routine, and the quarterly "QAPI Theater" audit becomes the check that keeps it that way — not a new program, but the same one, finally running.
1 · Why Quality Management Is Not Optional in Dialysis
In a dialysis unit, quality is not an administrative overlay on care — it is the care. The same discipline that keeps a patient's Kt/V above target keeps the unit's bloodstream-infection rate below it.
Maintenance hemodialysis is one of the most protocolised, highest-frequency, highest-acuity encounters in all of medicine: a patient with no residual homeostatic reserve is connected to an extracorporeal circuit, exposed to roughly 120–150 litres of water-derived dialysate per session, anticoagulated, and volume-shifted — three times a week, indefinitely. Every one of those steps is a failure mode. The physiology leaves no margin: a chloramine breakthrough, a reprocessing lapse, an unwitnessed access recirculation, a 3.5-litre ultrafiltration on a fragile heart — each converts directly into morbidity or death, often within a single session.
This is precisely why regulators worldwide converged on the same answer: dialysis facilities must run a structured, data-driven, continuous quality program — not periodic inspection, but an engine that surveils the whole system, detects drift before it harms, and drives measurable improvement. In the United States this is codified as QAPI (Quality Assurance and Performance Improvement) in the Medicare ESRD Conditions for Coverage. In the Philippines it is mandated twice over — the DOH requires a quality-improvement and information-management system for every licensed hemodialysis clinic, and the PSN 2024 HD Guidelines require both a written QAPI program and documented monthly CQI (Continuous Quality Improvement) meetings.7,8,9,15
The two terms — QAPI and CQI — are used loosely, often interchangeably, and that looseness is where programs go wrong. This field manual draws the distinction cleanly, then shows the clinical and administrative leadership team how to operate both as one integrated system: what to measure, against what targets, how often, who owns it, how to run an improvement project that actually moves a number, and how to satisfy DOH, PhilHealth, and PSN requirements without collapsing into "QAPI theater."
Who this is for, and its scope
The Medical Director / Dialysis Clinical Head (DCH), the Head Nurse, the Unit Operations Manager (UOM), the infection-control and technical leads, and the quality officer. Scope: in-center hemodialysis primarily, with peritoneal-dialysis and home-therapy notes where the metric set differs.

A four-stage progression showing how the terms build on each other: QA (Quality Assurance) is retrospective and inspection-based; PI (Performance Improvement) is prospective and process-focused; CQI (Continuous Quality Improvement) is the perpetual engine that plans, tests, and adopts changes; QAPI (Quality Assessment and Performance Improvement) is the regulatory synthesis that runs QA and PI together as one governed program.
- QA
- Quality Assurance
- PI
- Performance Improvement
- CQI
- Continuous Quality Improvement
- QAPI
- Quality Assessment and Performance Improvement
Unit A checked chloramine “when someone remembered.” One Monday the carbon tanks were spent; by the second shift six patients had falling hematocrits and dark plasma — hemolysis from chloramine breakthrough — before anyone linked it to the water. A fixed per-shift chloramine check, logged as a QAPI process control, would have caught it at the first reading, not the sixth patient. That is the difference between quality as paperwork and quality as care.
2 · QA, PI, QAPI, and CQI: Drawing the Distinction That Matters
Most quality failures in dialysis units are not failures of effort — they are failures of method. A unit that only counts adverse events after they happen is doing quality assurance; a unit that redesigns the process so the event becomes unlikely is doing quality improvement. QAPI is the deliberate marriage of the two. CQI is the cultural and operational engine that keeps the improvement half running continuously rather than in annual bursts.
2.1 The lineage, in one paragraph
Quality Assurance (QA) is the oldest layer: retrospective, inspection-based, threshold-and-compliance oriented — did we meet the standard? who is responsible for the miss? It is necessary (it catches the outlier) but insufficient (it is reactive, often punitive, and blind to the common-cause variation that produces most harm). Performance / Quality Improvement (PI/QI) grew out of industrial quality science (Shewhart, Deming, Juran): prospective, process-focused, data-driven, team-owned — why does the system produce this result, and how do we change the system? Continuous Quality Improvement (CQI) and Total Quality Management (TQM) are the philosophies that make improvement perpetual and organization-wide. QAPI — Quality Assurance and Performance Improvement — is the regulatory synthesis (formalised by CMS) that requires a facility to run both halves as one coordinated, governed program.3,4,5
2.2 The distinction, as a working table
| Dimension | Quality Assurance (QA) | Continuous Quality Improvement (CQI / PI) | QAPI (the integrated program) |
|---|---|---|---|
| Orientation in time | Retrospective — after the event | Prospective — before / around the event | Both, by design |
| Core question | "Did we meet the standard?" | "How do we make the system reliably better?" | "Are we meeting standards and systematically improving?" |
| Trigger | Threshold breach, complaint, audit | Continuous; opportunity-seeking | Continuous surveillance + triggered projects |
| Unit of attention | The outlier / the individual | The process / the system | System first, outliers investigated |
| Method | Inspection, chart audit, sanction | PDSA (Plan–Do–Study–Act), Lean, Six Sigma, RCA (Root Cause Analysis), FMEA (Failure Mode & Effects Analysis), SPC (Statistical Process Control) | QA tools plus PI methods under governance |
| Data use | Pass / fail against a bar | Variation over time (run / control charts) | Longitudinal metrics → projects → re-measurement |
| Culture | Accountability / "name-blame-shame" | Learning / "just culture" / front-line voice | Just culture with clear accountability |
| Cadence | Periodic (often annual, or event-driven) | Continuous; monthly cycles | Continuous monitoring; ≥ monthly CQI meeting |
| Typical output | Corrective action on a person | Redesigned workflow, sustained metric shift | Written plan, Performance Improvement Projects (PIPs), board-level reporting |
| In the PH mandate | DOH logbooks, medical / technical audits | Monthly documented CQI meetings (PSN) | Written QAPI plan + 9 metrics (PSN §D.3) |
Take-home
QA tells you the smoke alarm went off. CQI is why you rewired the kitchen. QAPI is the household rule that you do both, every month, and write it down. In a Philippine HD clinic the PSN guideline literally names both systems and assigns them to named roles — so the question is never "QAPI or CQI?" but "how do we run them as one loop?"15
2.3 The most common conceptual error
Treating CQI as a subset of QA ("we do quality — we review our incidents at a monthly meeting"). Reviewing incidents is QA. It becomes CQI only when the meeting (a) looks at the metric over time rather than the isolated event, (b) distinguishes common-cause from special-cause variation, (c) launches a tested change (PDSA) against a root cause, and (d) re-measures to confirm the change was an improvement. A meeting that adjourns with "we reminded staff to be careful" has produced QA documentation, not improvement.
A patient's Kt/V returns 1.05. The QA reflex is to flag the chart and remind the nurse to seat the needle better. The CQI move is to plot that patient's last six Kt/V values on a run chart, notice a steady slide that tracks a creeping reduction in run time, and test a “start-on-time” checklist. QAPI does both — the single miss is logged and the run-time process is redesigned and re-measured — so the number moves and stays moved.
3 · The Regulatory Architecture: A Crosswalk
A dialysis unit in the Philippines sits inside three concentric regulatory rings: international clinical / technical standards (what "good" looks like), DOH licensure (permission to operate), and PhilHealth accreditation + PSN attestation (permission to be paid and to be professionally endorsed). A functional QAPI program is the connective tissue that satisfies all three from a single data stream.
3.1 International layer
- CMS Medicare ESRD Conditions for Coverage (CfC), 42 CFR (Code of Federal Regulations) §494 — QAPI condition (§494.110). The 2008 CfC made QAPI a standalone condition of participation for every US dialysis facility: the program must be facility-designed, ongoing, comprehensive across all services (patient assessment, plan of care, water / dialysate quality, reuse, infection control, medical injuries / errors), and must "achieve measurable improvements" using objective indicators.1,3 CMS operationalises QAPI through five elements (Section 4). Although US-specific, this is the de-facto global template and the reference that DOH / PSN language mirrors.
- CMS QAPI "Five Elements" framework — Design & Scope; Governance & Leadership; Feedback, Data Systems & Monitoring; Performance Improvement Projects (PIPs); Systematic Analysis & Systemic Action.4,5
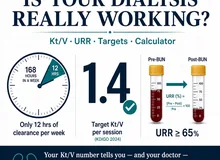
- KDIGO / KDOQI clinical standards — supply the numeric clinical targets a QAPI dashboard measures against: KDOQI 2015 Hemodialysis Adequacy (target spKt/V — single-pool Kt/V, the dimensionless dialysis-dose index — 1.4/session thrice-weekly, minimum delivered 1.2; alternative-schedule standard Kt/V 2.3/wk, min 2.1);10 KDIGO Anemia (individualised hemoglobin (Hgb), generally ~10–11.5 g/dL, avoid intentionally exceeding 11.5, transferrin saturation (TSAT) / ferritin-guided iron);12 KDIGO chronic kidney disease–mineral and bone disorder (CKD-MBD) (individualised calcium / phosphate / parathyroid hormone (PTH), correct hyperphosphatemia toward normal, PTH ~2–9× the upper limit of normal (ULN) of the assay on dialysis);13 and the International Society for Peritoneal Dialysis (ISPD) standard for peritoneal dialysis (PD) adequacy (total weekly Kt/V ≥ 1.7).
- ISO 23500 series (incorporating the American National Standards Institute (ANSI) / Association for the Advancement of Medical Instrumentation (AAMI) / ISO 13959) — water & dialysis-fluid quality. Dialysis water: bacteria < 100 colony-forming units per millilitre (CFU/mL) (action level 50 CFU/mL) and endotoxin < 0.25 endotoxin units per millilitre (EU/mL) (action level 0.125 EU/mL); ultrapure dialysate bacteria < 0.1 CFU/mL, endotoxin < 0.03 EU/mL.14 These are the technical key performance indicators (KPIs) in the QAPI water domain.
- Centers for Disease Control and Prevention (CDC) / National Healthcare Safety Network (NHSN) Dialysis Event Surveillance — the standard method and national benchmark for bloodstream infection (BSI) and access-related BSI. In the US pooled report, the overall BSI rate was 0.64 per 100 patient-months (0.26 for arteriovenous fistulas (AVF), 0.39 for arteriovenous grafts (AVG), 2.16 for central venous catheters (CVCs)), and 63–70% of BSIs occurred in CVC patients.6,11 Even where NHSN reporting is not mandated locally, its case definitions and rate denominators (events per 100 patient-months) are the right tools for the QAPI infection domain.
3.2 Philippine layer
- DOH Administrative Order (AO) No. 2012-0001 — New Rules and Regulations Governing the Licensure and Regulation of Dialysis Facilities in the Philippines. Applies to all government and private HD clinics; sets minimum standards for personnel, physical plant, equipment, water treatment per AAMI, documented service protocols, and mandates a quality-improvement and information-management system. License to Operate (LTO) valid 3 years.7
- DOH AO No. 2013-0003 — implementing guidelines for analysis, monitoring and maintenance of water used in dialysis (operationalises the AAMI water requirement).8
- DOH AO No. 2009-0012 — institutionalises the Philippine Renal Disease Registry (PRDR) under DOH; registry participation is a facility obligation.9
- PSN 2024 — Guidelines for Nephrologists in the Operation of Hemodialysis Clinics in the Philippines, 3rd Edition. The operational backbone. It explicitly requires both: a written QAPI program with periodic review and nine named metrics (§D.3), and monthly documented CQI meetings led by the DCH (§b10). It fixes Philippine-context operational numbers used in the dashboard — nurse:patient 1:4 (1:6 with a nursing assistant), physician-on-duty (POD):stations 1:15 (max 1:20), monthly water microbiology < 100 CFU/mL, six-monthly chemical water analysis, HD-machine lifespan ≤ 50,000 hours, reuse / reprocessing per AAMI with hepatitis / human immunodeficiency virus (HIV) segregation, and annual PRDR / Renal Disease Control Program (REDCOP) statistical reporting for LTO renewal.15
- PhilHealth — accredits facilities for the Outpatient Hemodialysis benefit, now 156 sessions/year (three-times-weekly for 52 weeks; the 45-day annual limit does not apply), case rate ₱6,350/session.16,17 Accreditation presupposes a DOH LTO and (for free-standing clinics) a track record of operation. QAPI data feeds directly into PhilHealth's outcome-and-quality expectations and protects claims integrity. Cross-reference the site's PhilHealth guides (Z packages, zero-balance billing, ACR → DRG).
3.3 The one-page crosswalk
| QAPI domain | International standard | Philippine requirement | Where the number lives |
|---|---|---|---|
| Program existence | CMS CfC §494.110 QAPI | DOH AO 2012-0001 QI/IM system; PSN §D.3 written QAPI + monthly CQI | PSN §D.3; b10 |
| Adequacy | KDOQI 2015 spKt/V ≥ 1.2 (target 1.4) | PSN QAPI metric "census & adequacy" (no PH numeric target → adopt KDOQI) | calc-dialysis-adequacy-ktv |
| Vascular access | Fistula-first; minimise catheters (NKF/KDOQI) | PSN access-management metric (no numeric target → adopt KDOQI / benchmark) | Dashboard §6.2 |
| Anemia | KDIGO Hgb ~10–11.5; TSAT / ferritin | PSN anemia-management metric; IV iron (avoid dextran), erythropoiesis-stimulating agent (ESA) | calc-eri, calc-iron-status-tsat |
| Infection / BSI | CDC-NHSN dialysis event; ISO water | PSN infection-control policies; DOH AO 2013-0003 water; vaccination | dialysis-access-infection |
| Water / technical | ISO 23500 / AAMI 13959 (<100 CFU/mL, <0.25 EU/mL) | PSN monthly micro <100 CFU/mL; chemical q6mo; DOH AO 2013-0003 | calc-wts-*, water-treatment guide |
| Registry / outcomes | ESRD registries; Standardized Mortality Ratio (SMR) / Standardized Hospitalization Ratio (SHR) benchmarking | PRDR / REDCOP annual report (DOH AO 2009-0012) mandatory for LTO | Dashboard §6.7 |
| Payer / quality | ESRD QIP (US) | PhilHealth accreditation; 156-session package | PhilHealth guides |
One data stream, three regulators. When the DOH licensing inspector asks for water-monitoring evidence, PhilHealth's accreditation reviewer asks for quality data, and the PSN chapter expects the DCH's CQI minutes, a unit with a functional QAPI program hands all three the same monthly CFU log, adverse-event logbook, and signed CQI minutes — no separate binder built for each. The crosswalk is the whole point.
4 · The Five Elements of a QAPI Program, Operationalised
CMS's five elements are the most useful scaffold for building a program because they force you past metrics-collection into governance and action.4,5 Here each element is translated into concrete duties mapped onto PSN roles.

The five QAPI elements as equal spokes around one governance hub — they run together, continuously, not as five separate checklists.
- QAPI
- Quality Assessment and Performance Improvement
Design & Scope
The program is written, ongoing, and comprehensive — it covers the full range of services (clinical care, water / dialysate, reprocessing / reuse, infection control, medication safety, environment, patient experience, staff competency) and defines aims, metrics, targets, data sources, cadence, and accountability. PH anchor: PSN §D.3(c) requires a written QAPI plan implemented continuously with periodic review, spanning the nine metric domains (§6).15
Governance & Leadership
The governing body / owner resources the program and holds it accountable, while creating an atmosphere where staff can raise problems without fear. PH anchor: the DCH initiates / implements QAPI and chairs the monthly CQI meeting; the UOM supervises the regular QAPI review in collaboration with the DCH; the Head Nurse schedules and co-owns corrective plans. Leadership sets the "just culture" tone (Section 7).15
Feedback, Data Systems & Monitoring
The unit puts systems in place to continuously pull data from multiple sources (clinical labs, machine / water logs, incident logbooks, patient grievances, staff reports) and turns them into monitored indicators with defined thresholds and trends. PH anchor: DOH logbooks, monthly water cultures, the complications / adverse-events logbook, and PRDR / REDCOP encoding are the raw feeds; the QAPI Scorecard tool (Section 11) is the aggregation layer.
Performance Improvement Projects (PIPs)
When surveillance flags a gap (or a strategic priority is chosen), the unit charters a time-bound, measured project using an improvement method and sees it through re-measurement. Run 1–3 PIPs at a time; don't boil the ocean. Section 9 gives a worked example.
Systematic Analysis & Systemic Action
The differentiator between a compliant binder and a learning organization: root causes are analysed with structured tools (RCA, FMEA, fishbone, "5 Whys"), and actions are systemic — they change the process / environment / standard work, not just the individual. Improvements are held (standardised, audited) so they don't decay.
How the five elements sit inside the monthly loop
Design & Scope (1) and Governance (2) are the standing architecture; Monitoring (3) runs continuously and is reviewed at the monthly CQI meeting; that review triggers PIPs (4) and systematic analysis / action (5), whose results feed back into monitoring. That is the QAPI ⟷ CQI loop.
The loop turning once. Monitoring (Element 3) shows phosphate-in-range slipping to 48%. The DCH charters a PIP (Element 4); a dietitian-led binder-teaching test (Element 5, systemic action) lifts it to 63% over two quarters. The winning script is written into standard work and audited monthly — held, not left to decay — and the result is reported to the governing body (Element 2), all inside the written scope (Element 1).
5 · The CQI Engine
QAPI is the governance shell; CQI is the engine inside it. These are the methods the leadership team should be fluent in — chosen to fit the problem.
5.1 The Model for Improvement + PDSA (the default workhorse)
Ask the three questions, then cycle PDSA:
- What are we trying to accomplish? — a numeric, time-bound aim ("increase the proportion of prevalent patients dialysing via AVF/AVG from 55% to 70% within 9 months").
- How will we know a change is an improvement? — the measure(s): an outcome measure, process measures, and a balancing measure (what might get worse).
- What change can we make that will result in improvement? — a change idea aimed at a root cause.
Then Plan → Do → Study → Act in small, fast, low-risk tests (often one nurse, a few patients, one week) before scaling. Rapid small cycles beat one big annual "initiative" because they surface implementation failure cheaply.18,19 FOCUS-PDCA (Find–Organize–Clarify–Understand–Select, then PDCA) is a useful front-end when the problem or process is fuzzy.20
5.2 Understanding variation: run charts & SPC (the most under-used skill)
Plot the metric over time, not as a monthly bar. A run chart (median centre-line) or statistical process control (SPC) control chart (mean ± control limits) tells you the one thing a threshold cannot: whether a change is signal or noise.
- Common-cause variation = the process's inherent noise. You cannot fix it by reacting to single points; you must redesign the process.
- Special-cause variation = a signal (a point beyond control limits, a run of ≥6–8 points one side of the centre-line, a trend). Investigate the specific cause.
Reacting to common-cause noise as if it were signal ("Kt/V dipped this month — retrain everyone!") is tampering — it usually increases variation. Teaching the CQI committee to read a control chart is the single highest-yield methodological upgrade in most units.21
5.3 Lean & Six Sigma (for waste and defects)
- Lean targets waste and flow — turnaround time between shifts, chair utilisation, supply stock-outs, wasted staff motion. Tools: value-stream mapping, 5S, standard work.
- Six Sigma (DMAIC: Define–Measure–Analyze–Improve–Control) targets defect / variation reduction — e.g., reducing variability in delivered vs prescribed Kt/V, or in heparin dosing. Use when you have enough data to be quantitative.22
5.4 Driver diagrams (to plan a portfolio of changes)
For a big aim, map Aim → Primary drivers → Secondary drivers → Change ideas. Example for "reduce catheter-related BSI": primary drivers = fewer catheters (access conversion) + safer catheter care (aseptic connection, exit-site protocol) + earlier detection; each spawns concrete, testable change ideas. The driver diagram keeps a multi-front project coherent and prevents the committee from betting everything on one idea.
5.5 Which method when (quick selector)
| Situation | Reach for |
|---|---|
| A single number is off target and you want to move it | Model for Improvement + PDSA |
| The problem / process is vague | FOCUS-PDCA, then PDSA |
| An adverse event already happened | RCA (retrospective) → systemic action |
| A new process / equipment before it harms anyone | FMEA (prospective risk) |
| "Is this change real or noise?" | Run chart / SPC control chart |
| Delays, stock-outs, wasted motion | Lean (value-stream mapping (VSM), 5S, standard work) |
| High-volume, quantifiable defect / variation | Six Sigma DMAIC |
| Complex aim needing many coordinated changes | Driver diagram |

The three working parts of the CQI engine, side by side: the PDSA cycle for testing a change, a run chart for telling signal from noise, and a driver diagram for connecting a big-picture aim to concrete change ideas.
- PDSA
- Plan-Do-Study-Act
Signal versus noise, on one chart. Unit-wide mean Kt/V dips from 1.50 to 1.42 in June. On the run chart it is a single point inside the usual scatter — common cause; “retrain everyone” would be tampering and usually widens the spread. In July one machine reads 1.10 for its four patients — a point clearly outside the pattern — special cause: its flow sensor had drifted and needed recalibration. The chart told the committee which variation to act on.
6 · The Dialysis QAPI Metric Set: The KPI Dashboard
This is the operational heart of the guide. The dashboard is organised by domain; each metric carries a definition, an evidence-based target / benchmark, a data source, a review cadence, and the linked site calculator / guide that computes or explains it. Targets are drawn from KDIGO / KDOQI / ISO / CDC where the PSN guideline defers on numbers (PSN specifies that a domain must be monitored, not the numeric bar — so the international target is adopted).10,12,13,14,15 Every metric should be plotted as a run / control chart, not just checked against the bar.
Reading the dashboard
Each domain is its own table. A DOH/PSN note in the cadence column flags a Philippine-mandated frequency (e.g., monthly water microbiology, annual PRDR/REDCOP). The "Linked tool" column deep-links the calculator or guide that computes or explains the metric.

What a data-driven monthly dashboard looks like on screen — sample metrics only, each tile carrying a label, a trend sparkline, and an on-target / watch / action-needed status badge.
- KPI
- Key Performance Indicator
- AVF
- Arteriovenous fistula
6.1 Dialysis adequacy & dose
| Metric | Target / benchmark | Source | Cadence | Linked tool |
|---|---|---|---|---|
| Delivered spKt/V (HD) | Min 1.2; target 1.4 (3×/wk) | Monthly urea kinetics | Monthly | calc-dialysis-adequacy-ktv |
| URR (urea reduction ratio) | ≥ 65% (surrogate) | Pre / post blood urea nitrogen (BUN) | Monthly | calc-hd-adequacy-npcr |
| % patients meeting adequacy | ≥ 90% at/above min | KPI roll-up | Monthly | calc-dialysis-prescription |
| PD total weekly Kt/V | ≥ 1.7 | PD kinetics | Quarterly | calc-pd-adequacy |
| Missed / shortened treatments | Track & minimise (missed HD ↑ mortality) | Attendance log | Monthly | — |
6.2 Vascular access
| Metric | Target / benchmark | Source | Cadence | Linked tool |
|---|---|---|---|---|
| Prevalent AVF/AVG use | ≥ 60–70% (fistula-first) | Access census | Monthly | dialysis-access-care |
| Prevalent CVC > 90 days | ≤ 10% (lower is better) | Access census | Monthly | dialysis-access-infection |
| Access-related infection rate | See §6.5 | NHSN method | Monthly | — |
| Access thrombosis / intervention rate | Trend | Procedure log | Monthly | — |
6.3 Anemia management
| Metric | Target / benchmark | Source | Cadence | Linked tool |
|---|---|---|---|---|
| Hb (hemoglobin) in target | ~10–11.5 g/dL; % in-range | Monthly complete blood count (CBC) | Monthly | anemia-management |
| % Hb < 9 and % Hb > 12 | Both minimised | CBC roll-up | Monthly | calc-esa-dose-adjustment |
| TSAT / ferritin in target | TSAT >20–30%, ferritin per KDIGO | Iron panel | Quarterly | calc-iron-status-tsat, calc-iv-iron-dose |
| ESA resistance index (ERI) | Flag high responders / resistance | Derived | Quarterly | calc-eri |
6.4 CKD-MBD, nutrition & volume
| Metric | Target / benchmark | Source | Cadence | Linked tool |
|---|---|---|---|---|
| Phosphate in range | Toward normal; % in-range | Monthly labs | Monthly | calc-ckd-mbd |
| Corrected calcium, PTH | Individualised (KDIGO) | Labs | Monthly / Qtrly | calc-corrected-calcium |
| Albumin / nutrition (nPCR) | Alb ≥ 3.5–4.0; nPCR 1.0–1.2 | Labs | Monthly / Qtrly | calc-npcr, calc-nri |
| Interdialytic weight gain | < ~4–4.5% body weight | Weights | Every session → monthly | calc-idwg-fluid |
| Ultrafiltration rate (UFR) | ≤ 13 mL/kg/h (≤10 if cardiac-fragile) | Session data | Monthly | calc-ultrafiltration-rate, calc-ufr-ceiling |
| Intradialytic hypotension rate | Trend & minimise | Session records | Monthly | calc-dry-weight-estimator |
6.5 Infection prevention & control
| Metric | Target / benchmark | Source | Cadence | Linked tool |
|---|---|---|---|---|
| BSI rate (per 100 pt-months) | Benchmark ~≤0.5; drive down; Standardized Infection Ratio (SIR) < 1 | NHSN dialysis-event method | Monthly | dialysis-access-infection |
| Access-related BSI rate | Trend down; CVC-focused | NHSN method | Monthly | — |
| IV antibiotic starts | Surveillance surrogate | Pharmacy / records | Monthly | — |
| Hepatitis B / C virus (HBV / HCV) seroconversions | Zero tolerance; investigate any | Serology surveillance | Per schedule | dialyzer-reprocessing-reuse |
| Vaccination coverage (HBV, influenza, pneumococcal, COVID-19) | ≥ 90% eligible; HBV 0-1-6 (double-dose) + post-titre | Immunisation log | Quarterly | wgmr-vaccination-tracker (PDF) |
| Hand-hygiene / aseptic-connection audit | ≥ 90% compliance | Direct observation | Monthly | — |
6.6 Water & dialysate quality (technical KPIs)
| Metric | Target / benchmark | Source | Cadence | Linked tool |
|---|---|---|---|---|
| Product-water bacteria | < 100 CFU/mL (action 50) | Culture | Monthly (DOH/PSN) | calc-wts-capacity |
| Product-water endotoxin | < 0.25 EU/mL (ISO 23500) | Limulus amebocyte lysate (LAL) assay | Monthly / per policy | — |
| Chemical water analysis (AAMI) | Within AAMI limits | Lab | Every 6 months (DOH/PSN) | water-treatment guide |
| Carbon tank EBCT (empty-bed contact time) | ≥ 6 min (chloramine) | Calc / log | Per policy | calc-carbon-tank-ebct |
| Chlorine / chloramine at breakthrough | Within limit pre-treatment | Point-of-care test | Each shift | — |
| Reverse osmosis (RO) % rejection / conductivity | Per spec | RO panel | Daily | calc-ro-recovery-dualpass |
| Loop disinfection done | Quarterly + on trigger | Maintenance log | Quarterly | — |
| Staff water-safety competency | Passing | Self-assessment | Annual | calc-wts-self-assessment |
6.7 Outcomes, hospitalisation & mortality (case-mix aware)
| Metric | Target / benchmark | Source | Cadence | Linked tool |
|---|---|---|---|---|
| Standardized Mortality Ratio (SMR) | < 1 vs expected | Registry / internal | Quarterly / annual | calc-smr-hospitalization-rate |
| Hospitalisation / admission rate | Trend down | Adverse-events logbook | Monthly | calc-smr-hospitalization-rate |
| Intradialytic / immediate deaths | Investigate each (RCA) | Complications logbook (DOH) | Per event | — |
| Modality transfer / technique failure | Track | Registry | Quarterly | — |
| PRDR/REDCOP annual report submitted | Yes (LTO-required) | Registry | Annual (DOH) | — |
A note on fairness
Raw mortality / hospitalisation must be case-mix adjusted (age, comorbidity, frailty, nutrition) before comparing months or units — otherwise a unit that accepts sicker patients looks "worse." Use Charlson / frailty / Nutritional Risk Index (NRI) as adjusters and interpret with care.
6.8 Patient experience & patient-reported outcomes
| Metric | Target / benchmark | Source | Cadence | Linked tool |
|---|---|---|---|---|
| KDQOL-36 (Kidney Disease Quality of Life, 36-item) (PCS / MCS / KDCS) | Track; low scores predict death / hospitalisation | Survey | 6–12 monthly | calc-dialysis-prom |
| Symptom burden (Dialysis Symptom Index (DSI) / Integrated Palliative care Outcome Scale–Renal (IPOS-Renal)) | Track & act | Survey | Periodic | calc-dialysis-prom |
| Patient experience (In-Center Hemodialysis Consumer Assessment of Healthcare Providers and Systems (ICH-CAHPS)-type) | Track domains | Survey | Annual | wgmr-ich-cahps-survey (PDF) |
| Grievances / complaints | Resolve; trend | Grievance log (PSN metric) | Monthly | wgmr-grievance-log (PDF) |
6.9 Staff, safety & risk (the PSN "risk management" domain)
| Metric | Target / benchmark | Source | Cadence | Linked tool |
|---|---|---|---|---|
| Falls, needle-stick injuries, med errors, blood spills | Trend to zero; RCA on sentinel | Incident logbook | Monthly | — |
| Medication reconciliation / error rate | Minimise | Pharmacy audit | Monthly | — |
| Advanced Cardiovascular Life Support (ACLS) activations / resuscitations / expiries (Medical Audit) | Review each | Medical audit (PSN §D.5) | Monthly | code-blue-acls-dialysis-unit |
| Preventive maintenance / reuse / water (Technical Audit) | 100% on schedule | Technical audit (PSN §D.5) | Monthly | — |
| Staff credentialing & CPE current | 100%; Basic Life Support (BLS) / ACLS current | 201 files | Annual | — |
| Nurse:patient ratio maintained | ≤ 1:4 (1:6 w/ NA); POD ≤ 1:15–1:20 | Staffing roster | Ongoing | — |
A row that points, not just scores. The infection row shows a BSI rate of 0.9 per 100 patient-months against the ≤0.5 benchmark — red. Read through the NHSN method, 68% of those events sit in the 22% of patients still dialysing through a catheter. The dashboard has not only flagged the problem; it has named the driver — catheters — and handed the next PIP its aim.
7 · Risk Management & Patient Safety
Element 5 of QAPI ("systematic analysis and action") lives here. Two complementary lenses: reactive (something happened — learn from it) and proactive (something could happen — prevent it).
7.1 Classifying events (shared language)
- Adverse event — injury caused by management, not the disease (PSN definition: caused death, prolonged hospitalisation, or disability at discharge).
- Sentinel event — a safety event reaching the patient with serious harm / death that signals the need for immediate investigation (e.g., wrong dialysate concentrate, air embolism, exsanguination from a disconnected line, ABO / transfusion error, patient fall with injury, HBV / HCV seroconversion).
- Near miss — an error that did not reach the patient. Near misses are gold: same lesson, no harm. A unit whose incident log is only harms is under-reporting near misses.
The PSN Complications / Adverse-Events logbook (DOH format) is the reactive data feed: it captures conditions delaying discharge, hospital admissions after HD, and deaths during / immediately after HD, plus outcome coding.15
7.2 Reactive tool — Root Cause Analysis (RCA)
Triggered by a sentinel event or a cluster. Structured, blame-free, systems-focused:
- Assemble a small multidisciplinary team promptly; secure records / equipment.
- Reconstruct the timeline (what happened, when, in what order).
- Ask "why" to system level — 5 Whys and a fishbone / Ishikawa across the classic dialysis categories: People, Process, Equipment / Technology, Environment, Materials / Supplies, Management / Policy.
- Identify root cause(s) — usually latent system conditions, not a "careless" individual.
- Systemic corrective actions ranked by strength (forcing functions / design > automation > standardisation / checklists > education / reminders; the last is the weakest and most over-used).
- Assign, date, and re-audit to confirm the fix held.

A worked fishbone diagram for a rising missed-treatment rate — trace the bone back to its branch to find where the fix belongs, not at the effect box.
7.3 Proactive tool — Failure Mode & Effects Analysis (FMEA)
Use before harm — new machine model, new concentrate supplier, a redesigned patient-connection workflow, opening a new isolation area. Map the process steps; for each failure mode score Severity × Occurrence × Detectability = Risk Priority Number (RPN); attack the highest-RPN modes with design changes; re-score. FMEA is how you keep a change from becoming next quarter's RCA.
7.4 Just Culture (the cultural precondition)
Improvement data only flows if reporting is safe
Just Culture distinguishes human error (console the person, fix the system), at-risk behaviour (coach, remove the incentive to drift), and reckless behaviour (accountable — this is rare). Punishing human error guarantees under-reporting and blinds the QAPI program. Governance (Element 2) owns setting this tone — the DCH and owner must protect the staff member who reports their own near miss.
Why “careless nurse” is the wrong root cause. A patient receives the wrong dialysate concentrate. The 5-Whys walks past the individual to a latent system condition: two concentrates stored side by side in near-identical jugs. The strongest fix is not re-education but a forcing function — colour-coded, physically separated concentrate stations so the wrong jug cannot be hung. That is Element 5 turning an RCA into a change that holds.
8 · Governance, Roles, Cadence & Documentation
QAPI without governance is a spreadsheet nobody acts on. The PSN guideline conveniently assigns the roles; the leadership team should ratify them in a one-page QAPI charter.
8.1 Role map (from PSN 2024)15
| Role | QAPI / CQI responsibility |
|---|---|
| Owner / governing body | Resources the program; receives quarterly QAPI report; sets just-culture expectation; ultimate accountability |
| Dialysis Clinical Head (DCH) / Medical Director | Initiates & implements the QAPI program (documented); chairs the monthly CQI meeting (documented); enforces infection control & AAMI water standards; credentialing; charters PIPs |
| Unit Operations Manager (UOM) | Supervises the regular QAPI review with the DCH; builds systems to improve service quality; required as a distinct role when > 15 stations |
| Head Nurse | Schedules & attends CQI meetings; co-develops corrective plans; ensures infection-control implementation; owns nursing-sensitive metrics |
| Infection-control lead | BSI / seroconversion surveillance (NHSN method), hand-hygiene audits, vaccination tracking |
| Technical / biomed lead | Water & machine KPIs, PM schedule, reuse program (Technical Audit) |
| Medical Records Officer / Registry coordinator | PRDR / REDCOP encoding & annual report; logbook completeness; minutes |
| Quality officer (if resourced) | Aggregates the scorecard, maintains run charts, tracks PIP status |
8.2 The monthly CQI meeting (the operating rhythm)
Mandated by PSN §b10: at least monthly, documented. A tight, standing agenda turns the meeting from QA recital into a CQI engine:
Safety huddle first
Any sentinel event / near miss since last meeting → RCA status.
Dashboard review by run chart
Walk the KPI set; flag special-cause signals only (don't tamper with noise).
PIP standup
Each active PIP: current PDSA cycle, data, next step, barriers.
New / red metrics → charter or escalate
Decide: monitor, quick fix, or new PIP.
Technical & medical audit items
(PSN §D.5), infection & water review, PhilHealth / registry compliance.
Actions with owner + date
Minutes filed (attendance logbook + minutes are DOH / PSN-required records).
8.3 Documentation set (audit-ready)
Written QAPI plan; monthly CQI minutes + attendance; complications / adverse-events logbook; medical & technical audit records; water results (monthly micro, six-monthly chemical) + disinfection log; immunisation register; incident / near-miss reports + RCAs; PIP charters + run charts; PRDR / REDCOP annual report; staff 201 / credentialing / CPE files. This set simultaneously satisfies DOH LTO renewal, PhilHealth accreditation, and PSN attestation from one program.
Forty-five minutes that decide something. June's CQI meeting opens with a needle-stick near-miss (safety huddle first), walks the run charts and touches only the special-cause catheter-BSI trend, hears the third PDSA cycle of the catheter-reduction PIP, and closes with three actions — each with an owner and a date. The minutes are filed; the DOH/PSN record is a by-product, not a separate chore.
9 · Running a Performance Improvement Project (Worked Example)
Problem surfaced by the dashboard: BSI rate drifting up over 4 months; run chart shows a special-cause trend; 68% of BSIs are in the 22% of patients still on tunnelled CVCs.
1. Charter (Model for Improvement)
- Aim: Reduce the unit's BSI rate from 0.9 to ≤ 0.5 per 100 patient-months within 6 months, and cut prevalent CVC use from 22% to ≤ 12% within 9 months.
- Measures: Outcome — BSI rate (NHSN method), CVC prevalence. Process — % aseptic catheter connections observed, % eligible patients referred for AVF, exit-site protocol adherence. Balancing — AVF creation complication / steal rate, staff time.
2. Driver diagram
Primary drivers → fewer catheters (referral pathway, surgeon coordination, patient education) · safer catheter care (standardised aseptic connection, chlorhexidine exit-site protocol, catheter-cap standardisation) · earlier detection (staff BSI-symptom checklist, blood-culture-before-antibiotic rule).
3. PDSA cycles (small, fast)
- Cycle 1: one nurse, one shift, one week — standardised aseptic-connection checklist at the chair. Study compliance + feedback. Act: refine wording, then spread to the shift.
- Cycle 2: pilot a chlorhexidine exit-site protocol on 5 CVC patients ×2 weeks; measure exit-site scores.
- Cycle 3: stand up a nurse-driven AVF-referral pathway; test with the next 5 eligible catheter patients.
4. Systematic analysis
For each new BSI during the project → mini-RCA feeding back into the drivers.
5. Hold the gains
Standardise the winning changes into standard work; add a monthly aseptic-connection audit to the dashboard; keep the CVC-prevalence run chart on the standing agenda. Report outcome to the governing body.
The whole QAPI ⟷ CQI loop in one project
Surveillance (Element 3) → PIP (4) → systematic analysis / action (5) under governance (2) within the written scope (1).
What the numbers did. By month 6 the unit's BSI run chart had fallen from 0.9 to 0.4 per 100 patient-months and stayed there for three consecutive months — a sustained shift, not a lucky dip — while prevalent catheter use dropped from 22% to 14%. The balancing measure held: the accelerated fistula referrals produced no rise in steal-syndrome complications. The winning changes became standard work and stayed on the standing agenda.
10 · Philippine Implementation & Payer / Registry Integration
A functional QAPI program should pay for itself in the Philippine system by protecting licensure, accreditation, claims, and — above all — patients.
- DOH LTO (AO 2012-0001). The QI / information-management system, water monitoring (AO 2013-0003), staffing ratios, and documentation set are directly inspected. Your QAPI documentation is your LTO-renewal evidence.7,8
- PRDR / REDCOP (AO 2009-0012). Annual statistical reporting is required for LTO renewal; build registry encoding into the records workflow so the annual report is a by-product, not a scramble.9,15
- PhilHealth accreditation & the 156-session package. Accreditation presumes a DOH LTO and quality compliance; the ₱6,350/session case rate and 156-session ceiling make adequacy, missed-treatment, and complication metrics financially as well as clinically material. Tie the QAPI dashboard to claims integrity and to the Zero Balance / Konsulta pathways — see Z packages, zero-balance billing, ACR → DRG.16,17
- PSN attestation. The DCH's monthly documented CQI meetings and written QAPI plan are the professional-society expectation and the escalation pathway for non-compliance runs through the local Chapter HD Committee.15
- Local reality checks. Build the dashboard to survive Philippine operating conditions: disaster / continuity metrics (typhoon, flooding, power — see typhoon preparedness), heat / El Niño volume-status stress (El Niño & heat), generator readiness (≥ 20 KVA, PSN), and supply-chain / reuse integrity.
Compliance as a by-product. A Cebu unit builds PRDR/REDCOP encoding into its monthly records close. At LTO-renewal time the annual registry report prints from data already entered — no year-end scramble — and the same dataset answers the PhilHealth accreditation visit and the PSN attestation. The QAPI program pays for itself in avoided rework and protected accreditation.
11 · The QAPI Scorecard Tool, in the Guide
The Dialysis Unit QAPI Scorecard & CQI Tracker is the artifact that converts the monthly CQI meeting from a discussion into a decision: the leadership team enters the month's numbers; the tool flags red / amber / green against the targets in Section 6, computes composite domain scores and a unit QAPI index, and (critically) prompts a PDSA charter for any red metric. Output is printable for the minutes and for DOH / PhilHealth / PSN documentation.
How to run your meeting from this scorecard
Enter the month's numbers before the meeting. Open the scorecard on the shared screen. Walk the domains top-to-bottom (Section 8.2 order): reds first — each red already carries a drafted PDSA charter stub, so decide monitor / quick-fix / new PIP on the spot. Confirm any hard reds (a hepatitis seroconversion, water CFU ≥ 100 or endotoxin ≥ 0.25 EU/mL, an overdue chemical analysis, an intradialytic death) are already in RCA. Assign owner + date for each action, then print the scorecard into the minutes. The printed page doubles as DOH / PhilHealth / PSN documentation.
From discussion to decision. The leadership team enters June's numbers before the meeting. The scorecard flags phosphate-in-range red and auto-drafts a PDSA aim — “lift phosphate-in-range from 48% to 60% by December.” The meeting no longer spends its time re-establishing that there is a problem; it spends it choosing the change idea and naming the owner. The printed page becomes the minutes.
12 · Pitfalls: "QAPI Theater" vs. a Functional Program
| QAPI theater (compliance only) | Functional QAPI (improvement) |
|---|---|
| Binder updated the week before inspection | Living dashboard reviewed monthly |
| Metrics shown as monthly bars | Metrics shown as run / control charts |
| Reacting to every wiggle ("tampering") | Acting only on special-cause signals |
| "We re-educated staff" as the standing fix | Systemic changes ranked above education |
| Incident log = harms only | Near misses actively surfaced (Just Culture) |
| 12 projects, none finished | 1–3 PIPs, measured to completion |
| Raw mortality compared month-to-month | Case-mix–adjusted interpretation |
| QAPI owned by "the quality person" | Owned by governance; front-line voice at the table |
| Meeting adjourns with no owner / date | Every action has an owner and a date |
The single test
Pull any one metric's run chart and ask: did we act on a special-cause signal, and did the number move and stay moved? If yes, you have a functional QAPI program. If the honest answer is "we discussed it and reminded staff to be careful," you have QAPI theater — regardless of how thick the binder is.
Two units, same shelf. Unit X's QAPI binder is immaculate at inspection and untouched between visits; its incident log contains only harms. Unit Y's dashboard is reviewed every month, its near-miss log is longer than its harm log (a healthy sign of open reporting), and one or two PIPs are always running to completion. The paperwork looks similar on the shelf — but only one unit is actually getting safer.